3. Pairwise similarity/dissimilarity metrics
Maxime Lenormand, Boris Leroy and Pierre Denelle
2026-07-21
Source:vignettes/a3_pairwise_metrics.Rmd
a3_pairwise_metrics.Rmd1. Compute pairwise similarity metrics
The function similarity
computes well-known and customized pairwise similarity metrics based on
a co-occurrence matrix, such as vegemat.
In the example below, the Simpson similarity index is
computed between each pair of sites.
sim <- similarity(vegemat,
                  metric = "Simpson",
                  formula = NULL,
                  method = "prodmat")
sim[1:10,]
## Data.frame of similarity between sites
## - Total number of sites: 715
## - Total number of species: 3697
## - Number of rows: 255255
## - Number of similarity metrics: 1
##
##
## Site1 Site2 Simpson
## 2 35 36 0.9767442
## 3 35 37 0.9689922
## 4 35 38 0.9457364
## 5 35 39 0.9457364
## 6 35 84 0.2790698
## 7 35 85 0.9147287
## 8 35 86 1.0000000
## 9 35 87 0.9922481
## 10 35 88 0.9844961
## 11 35 89 0.6821705The resulting data.frame is stored in a
bioregion.pairwise object, which contains the Simpson
similarity metric between each pair of sites. The function similarity
can handle three types of metrics: metrics based on abc,
metrics based on ABC, and one metric based on the Euclidean
distance.
The first kind of metrics such as Jaccard, the turnover component of Jaccard (Baselga, 2012), Simpson or Sørensen are based on presence data with \(a\) the number of species shared by a pair of sites, \(b\) species only present in the first site and \(c\) species only present in the second site.
\[\displaystyle Jaccard = 1 - \frac{b +
c}{a + b + c}\] \[\displaystyle
Jaccardturn = 1 - \frac{2 \cdot min(b, c)}{a + 2 \cdot min(b,
c)}\] \[\displaystyle Sorensen = 1 -
\frac{b + c}{2 \cdot a + b + c}\] \[\displaystyle Simpson = 1 - \frac{min(b, c)}{a +
min(b, c)}\] Two methods can be used to compute the
abc based metrics. The first method is based on a matrix
product (performed with the tcrossprod
function from the R package Matrix).
The method is fast but is greedy in memory… The second method is based
on a three
loops function coded in C++ and largely inspired by the bcdist
function from the R package ecodist
(version 2.0.7). It is less efficient than the matrix product but allows
to handle co-occurrence matrix with a large number of sites and/or
species.
The second kind of metrics such as Bray-Curtis and the turnover
component of Bray-Curtis (Baselga, 2012)
are based on abundance data with \(A\)
the sum of the lesser values for common species shared by a pair of
sites. \(B\) and \(C\) are the total number of specimens
counted at both sites minus \(A\). Only
three loops function is available for the ABC based
metrics.
\[\displaystyle Bray = 1 - \frac{B + C}{2 \cdot A + B + C}\] \[\displaystyle Brayturn = 1 - \frac{min(B, C)}{A + min(B, C)}\]
The main advantage of the similarity
function is to compute and return several metrics, to allow the
computation of customized metric with the formula argument
and to include the possibility of returning the quantities \(a\), \(b\)
and \(c\) and/or \(A\), \(B\)
and \(C\). This feature is particularly
interesting to compute similarity metrics on large co-occurrence
matrix.
sim <- similarity(vegemat,
                  metric = c("abc","ABC","Simpson","Bray"),
                  formula = c("1 - pmin(b,c) / (a + pmin(b,c))", "1 - (B + C) / (2*A + B + C)"))
sim[1:10,]
## Data.frame of similarity between sites
## - Total number of sites: 715
## - Total number of species: 3697
## - Number of rows: 255255
## - Number of similarity metrics: 4
##
##
## Site1 Site2 Simpson Bray a b c A B C
## 2 35 36 0.9767442 0.01901485 126 3 741 420 3 43333
## 3 35 37 0.9689922 0.03745203 125 4 534 366 57 18756
## 4 35 38 0.9457364 0.04025289 122 7 440 347 76 16471
## 5 35 39 0.9457364 0.09754761 122 7 501 356 67 6520
## 6 35 84 0.2790698 0.18757921 36 93 177 74 349 292
## 7 35 85 0.9147287 0.13256181 118 11 614 378 45 4902
## 8 35 86 1.0000000 0.02663928 129 0 753 415 8 30319
## 9 35 87 0.9922481 0.02332663 128 1 909 406 17 33981
## 10 35 88 0.9844961 0.02198536 127 2 812 395 28 35115
## 11 35 89 0.6821705 0.15954416 88 41 177 196 227 1838
## 1 - pmin(b,c) / (a + pmin(b,c)) 1 - (B + C) / (2*A + B + C)
## 2 0.9767442 0.01901485
## 3 0.9689922 0.03745203
## 4 0.9457364 0.04025289
## 5 0.9457364 0.09754761
## 6 0.2790698 0.18757921
## 7 0.9147287 0.13256181
## 8 1.0000000 0.02663928
## 9 0.9922481 0.02332663
## 10 0.9844961 0.02198536
## 11 0.6821705 0.15954416It is also possible to compute Euclidean similarity between each pair of sites following this equation:
\[\displaystyle Euclidean = \frac{1}{1 + d_{ij}}\] where \(d_{ij}\) is the Euclidean distance between site \(i\) and site \(j\) in terms of species composition.
2. Compute pairwise dissimilarity metrics
The dissimilarity function is very similar, with the sole exception that it computes the dissimilarity version of the available metrics. It corresponds to 1 minus the similarity metrics, except for the Euclidean dissimilarity, which corresponds to the Euclidean distance (i.e. \(d_{ij}\)).
dissim <- dissimilarity(vegemat,
                        metric = "Sorensen",
                        formula = "(b + c) / (2*a + b + c)")
dissim[1:10,]
## Data.frame of dissimilarity between sites
## - Total number of sites: 715
## - Total number of species: 3697
## - Number of rows: 255255
## - Number of dissimilarity metrics: 2
##
##
## Site1 Site2 Sorensen (b + c) / (2*a + b + c)
## 2 35 36 0.7469880 0.7469880
## 3 35 37 0.6827411 0.6827411
## 4 35 38 0.6468886 0.6468886
## 5 35 39 0.6755319 0.6755319
## 6 35 84 0.7894737 0.7894737
## 7 35 85 0.7259001 0.7259001
## 8 35 86 0.7448071 0.7448071
## 9 35 87 0.7804460 0.7804460
## 10 35 88 0.7621723 0.7621723
## 11 35 89 0.5532995 0.55329953. From similarity to dissimilarity (and vice versa)
The functions similarity_to_dissimilarity and dissimilarity_to_similarity and can be used to switch easily switch between similarity and dissimilarity metrics.
sim1 <- similarity(vegemat,
                  metric = c("abc","Sorensen"),
                  formula = "1 - (b + c) / (2*a + b + c)")
sim1[1:10,]
## Data.frame of similarity between sites
## - Total number of sites: 715
## - Total number of species: 3697
## - Number of rows: 255255
## - Number of similarity metrics: 2
##
##
## Site1 Site2 Sorensen a b c 1 - (b + c) / (2*a + b + c)
## 2 35 36 0.2530120 126 3 741 0.2530120
## 3 35 37 0.3172589 125 4 534 0.3172589
## 4 35 38 0.3531114 122 7 440 0.3531114
## 5 35 39 0.3244681 122 7 501 0.3244681
## 6 35 84 0.2105263 36 93 177 0.2105263
## 7 35 85 0.2740999 118 11 614 0.2740999
## 8 35 86 0.2551929 129 0 753 0.2551929
## 9 35 87 0.2195540 128 1 909 0.2195540
## 10 35 88 0.2378277 127 2 812 0.2378277
## 11 35 89 0.4467005 88 41 177 0.4467005
dissim1 <- dissimilarity(vegemat,
                         metric = c("abc","Sorensen"),
                         formula = "(b + c) / (2*a + b + c)")
dissim1[1:10,]
## Data.frame of dissimilarity between sites
## - Total number of sites: 715
## - Total number of species: 3697
## - Number of rows: 255255
## - Number of dissimilarity metrics: 2
##
##
## Site1 Site2 Sorensen a b c (b + c) / (2*a + b + c)
## 2 35 36 0.7469880 126 3 741 0.7469880
## 3 35 37 0.6827411 125 4 534 0.6827411
## 4 35 38 0.6468886 122 7 440 0.6468886
## 5 35 39 0.6755319 122 7 501 0.6755319
## 6 35 84 0.7894737 36 93 177 0.7894737
## 7 35 85 0.7259001 118 11 614 0.7259001
## 8 35 86 0.7448071 129 0 753 0.7448071
## 9 35 87 0.7804460 128 1 909 0.7804460
## 10 35 88 0.7621723 127 2 812 0.7621723
## 11 35 89 0.5532995 88 41 177 0.5532995
dissim2 <- similarity_to_dissimilarity(sim1)
dissim2[1:10,]
## Data.frame of dissimilarity between sites
## - Total number of sites: 715
## - Total number of species: 3697
## - Number of rows: 255255
## - Number of dissimilarity metrics: 2
##
##
## Site1 Site2 Sorensen a b c 1 - (b + c) / (2*a + b + c)
## 2 35 36 0.7469880 126 3 741 0.7469880
## 3 35 37 0.6827411 125 4 534 0.6827411
## 4 35 38 0.6468886 122 7 440 0.6468886
## 5 35 39 0.6755319 122 7 501 0.6755319
## 6 35 84 0.7894737 36 93 177 0.7894737
## 7 35 85 0.7259001 118 11 614 0.7259001
## 8 35 86 0.7448071 129 0 753 0.7448071
## 9 35 87 0.7804460 128 1 909 0.7804460
## 10 35 88 0.7621723 127 2 812 0.7621723
## 11 35 89 0.5532995 88 41 177 0.5532995
sim2 <- dissimilarity_to_similarity(dissim1)
sim2[1:10,]
## Data.frame of similarity between sites
## - Total number of sites: 715
## - Total number of species: 3697
## - Number of rows: 255255
## - Number of similarity metrics: 2
##
##
## Site1 Site2 Sorensen a b c (b + c) / (2*a + b + c)
## 2 35 36 0.2530120 126 3 741 0.2530120
## 3 35 37 0.3172589 125 4 534 0.3172589
## 4 35 38 0.3531114 122 7 440 0.3531114
## 5 35 39 0.3244681 122 7 501 0.3244681
## 6 35 84 0.2105263 36 93 177 0.2105263
## 7 35 85 0.2740999 118 11 614 0.2740999
## 8 35 86 0.2551929 129 0 753 0.2551929
## 9 35 87 0.2195540 128 1 909 0.2195540
## 10 35 88 0.2378277 127 2 812 0.2378277
## 11 35 89 0.4467005 88 41 177 0.44670054. Comparison with other R packages
bioregion is not the only R package that allows the
computation of similarity, dissimilarity, distance, and \(\beta\)-diversity metrics based on a
(site-species) co-occurrence matrix. In this section, we
focus on several functions provided by the packages adespatial, betapart, ecodist, and vegan.
The table below displays the main differences between these packages
in terms of dissimilarity metric computation. The bioregion
package is the only one that allows the computation of several metrics
returned as a data.frame in a network format. It also
supports the use of custom formulas based on the a,
b, c, A, B and
C components. This flexibility is also available in vegan via the
designdist function.
bioregion also allows the computation of the
a, b, c, A,
B and C components. Users can choose to
extract none of the components, only the three abc
components, only the three ABC components, or all six
components. These components (abc or ABC
separately) can also be accessed in adespatial
using the beta.div.comp function, and in betapart using
betapart.core and betapart.core.abund.
Finally, the vegan package, via
the designdist function, also allows the extraction of the
a, b, c, A,
B or C components separately.
| adespatial (0.3-28) | betapart (1.6) | bioregion (1.2.0) | ecodist (2.1.3) | vegan (2.6-10) | |
|---|---|---|---|---|---|
| Format | matrix | matrix | data.frame (network) | matrix | matrix |
| Custom formulas | no | no | yes | no | yes |
| abc/ABC | yes (abc or ABC) | yes (abc or ABC) | yes (abc and ABC) | no | yes (a, b, c, A, B or C) |
| Several metrics | no | no | yes | no | no |
4.1 Basic comparison (Jaccard and Bray-Curtis)
We first present a basic comparison of the computation of two
well-known metrics, Jaccard and Bray-Curtis, based on a small
co-occurrence matrix.
nbsite <- 100
nbsp <- 200

set.seed(1)
comat <- matrix(runif(nbsite*nbsp), nbsite, nbsp)
rownames(comat) <- paste0("s", 1:nbsite)
colnames(comat) <- paste0("sp", 1:nbsp)

comatbin <- comat
comatbin[comat > 0.7] <- 1
comatbin[comat <= 0.7] <- 0
4.1.1 Jaccard
We propose below a comparison of computation time for generating a
Jaccard dissimilarity matrix based on the comatbin defined
above. It should be noted that the output of beta.div and
dissimilarityrequires an additional step to obtain a
dissimilarity matrix. Specifically, beta.div returns the
root mean square of the desired quantity, and as shown above,
dissimilarity outputs the metric in a network
(data.frame) format, as it supports the computation of
multiple metrics.
The beta.pair function is used for the betapart package.
Two functions, distance and bcdist, are used
from the ecodist package.
We also use the two available functions, vegdist and
designdist, from the vegan package.
dissim <- list()

comp_j <- microbenchmark(

  adespatial = { d <- beta.div(comatbin,
                               method = "jaccard",
                               samp = FALSE,
                               nperm = 1,
                               save.D = TRUE)
  d <- as.matrix(d$D)
  d <- d*d
  dissim$adespatial <- d},

  betapart = { d <- beta.pair(comatbin,
                              index.family = "jaccard")
  d <- as.matrix(d$beta.jac)
  dissim$betapart <- d},

  bioregion = { d <- dissimilarity(comatbin,
                                   metric = "Jaccard")
  d <- net_to_mat(d,
                  weight = TRUE,
                  squared = TRUE,
                  symmetrical = TRUE)
  dissim$bioregion <- d },

  ecodist_dist = { d <- distance(comatbin,
                                 method = "jaccard")
  d <- as.matrix(d)
  dissim$ecodist_dist <- d },

  ecodist_bcdist = { d <- bcdist(comatbin)
  d <- as.matrix(d)
  dissim$ecodist_bcdist <- d },

  vegan_veg = { d <- vegdist(comatbin,
                             method = "jaccard")
  d <- as.matrix(d)
  dissim$vegan_veg <- d },

  vegan_design = { d <- designdist(comatbin,
                                   method = "(A+B-2*J)/(A+B-J)",
                                   terms = "binary")
  d <- as.matrix(d)
  dissim$vegan_design <- d },

  times = 10
)
After ensuring that all the functions return the same dissimilarity matrix,
all_identical <- all(
  identical(trunc(dissim$adespatial, digits=4),
            trunc(dissim$betapart, digits=4)),
  identical(trunc(dissim$adespatial, digits=4),
            trunc(dissim$bioregion, digits=4)),
  identical(trunc(dissim$adespatial, digits=4),
            trunc(dissim$ecodist_dist , digits=4)),
  identical(trunc(dissim$adespatial, digits=4),
            trunc(dissim$ecodist_bcdist , digits=4)),
  identical(trunc(dissim$adespatial, digits=4),
            trunc(dissim$vegan_veg, digits=4)),
  identical(trunc(dissim$adespatial, digits=4),
            trunc(dissim$vegan_design, digits=4))
)
print(all_identical)
## [1] TRUEwe proceed with a comparison of their computation times.
comp_j## Unit: milliseconds
## expr min lq mean median uq
## adespatial 370.345862 380.390821 382.104360 381.728988 387.134188
## betapart 1.737504 1.867456 1.936809 1.924225 1.954595
## bioregion 14.440248 15.112824 16.984381 15.584658 16.071444
## ecodist_dist 139.444967 162.844204 161.966290 166.469995 168.681150
## ecodist_bcdist 3.904884 4.240751 4.249565 4.289103 4.308011
## vegan_veg 1.342719 1.451360 2.084140 2.435137 2.461786
## vegan_design 1.324242 1.330761 1.411749 1.393484 1.406373
## max neval
## 389.167170 10
## 2.324873 10
## 29.692739 10
## 169.880646 10
## 4.347409 10
## 2.505872 10
## 1.781319 10On this very small example, the functions from vegan outperform the
others in terms of computation time. They are followed by
bcdist and beta.pair. Our
dissimilarity function performs slightly slower, partly due
to the additional reformatting step (from matrix to network and back).
The distance and beta.div functions rank
significantly lower in terms of speed.
4.1.2 Bray-Curtis
We present below a similar example using the Bray-Curtis
dissimilarity metric, based on the comat defined above.
dissim <- list()

comp_bc <- microbenchmark(

  adespatial = { d <- beta.div(comat,
                               method = "percentdiff",
                               samp = FALSE,
                               nperm = 1,
                               save.D = TRUE)
  d <- as.matrix(d$D)
  d <- d*d
  dissim$adespatial <- d},

  betapart = { d <- beta.pair.abund(comat,
                                    index.family = "bray")
  d <- as.matrix(d$beta.bray)
  dissim$betapart <- d},

  bioregion = { d <- dissimilarity(comatbin,
                                   metric = "Bray")
  d <- net_to_mat(d,
                  weight = TRUE,
                  squared = TRUE,
                  symmetrical = TRUE)
  dissim$bioregion <- d },

  ecodist_dist = { d <- distance(comat,
                                 method = "bray-curtis")
  d <- as.matrix(d)
  dissim$ecodist_dist <- d },

  ecodist_bcdist = { d <- bcdist(comat)
  d <- as.matrix(d)
  dissim$ecodist_bcdist <- d },

  vegan_veg = { d <- vegdist(comatbin,
                             method = "bray")
  d <- as.matrix(d)
  dissim$vegan_veg <- d },

  vegan_design = { d <- designdist(comat,
                                   method = "(A+B-2*J)/(A+B)",
                                   terms = "minimum")
  d <- as.matrix(d)
  dissim$vegan_design <- d },

  times = 10
)
Here again after ensuring that all the functions return the same dissimilarity matrix,
all_identical <- all(
  identical(trunc(dissim$adespatial, digits=4),
            trunc(dissim$betapart, digits=4)),
  identical(trunc(dissim$adespatial, digits=4),
            trunc(dissim$bioregion, digits=4)),
  identical(trunc(dissim$adespatial, digits=4),
            trunc(dissim$ecodist_dist , digits=4)),
  identical(trunc(dissim$adespatial, digits=4),
            trunc(dissim$ecodist_bcdist , digits=4)),
  identical(trunc(dissim$adespatial, digits=4),
            trunc(dissim$vegan_veg, digits=4)),
  identical(trunc(dissim$adespatial, digits=4),
            trunc(dissim$vegan_design, digits=4))
)
print(all_identical)
## [1] TRUEwe proceed with a comparison of their computation times.
comp_bc## Unit: milliseconds
## expr min lq mean median uq
## adespatial 367.074538 367.933189 377.267609 379.435261 382.667993
## betapart 297.285290 314.129158 324.167720 318.240577 336.929709
## bioregion 11.718947 11.967155 12.638151 12.155043 12.613001
## ecodist_dist 94.049791 97.093248 143.584659 105.262858 120.833151
## ecodist_bcdist 6.639133 6.664211 6.870140 6.893180 7.071063
## vegan_veg 1.325053 1.363960 1.803075 1.421310 2.430190
## vegan_design 1.275219 1.366474 1.504754 1.437744 1.775079
## max neval
## 391.728633 10
## 354.668142 10
## 14.768274 10
## 471.216656 10
## 7.085505 10
## 2.480334 10
## 1.796991 10The functions from vegan continue to
outperform the others. They are again followed by bcdist,
while our dissimilarity function remains slightly slower.
The distance and beta.div functions, joined by
beta.pair.abund, rank significantly lower in terms of
computation speed.
4.2 Systematic comparison (Jaccard and Bray-Curtis)
These differences in computation times become noticeable only for
(site-species) co-occurrence matrix objects of significant
size. To better understand the computation times for such matrices, we
perform a similar experiment using a subset of functions
(beta.pair and beta.pair.abund,
dissimilarity, bcdist, vegdist,
and designdist) on datasets with varying numbers of sites
and species.
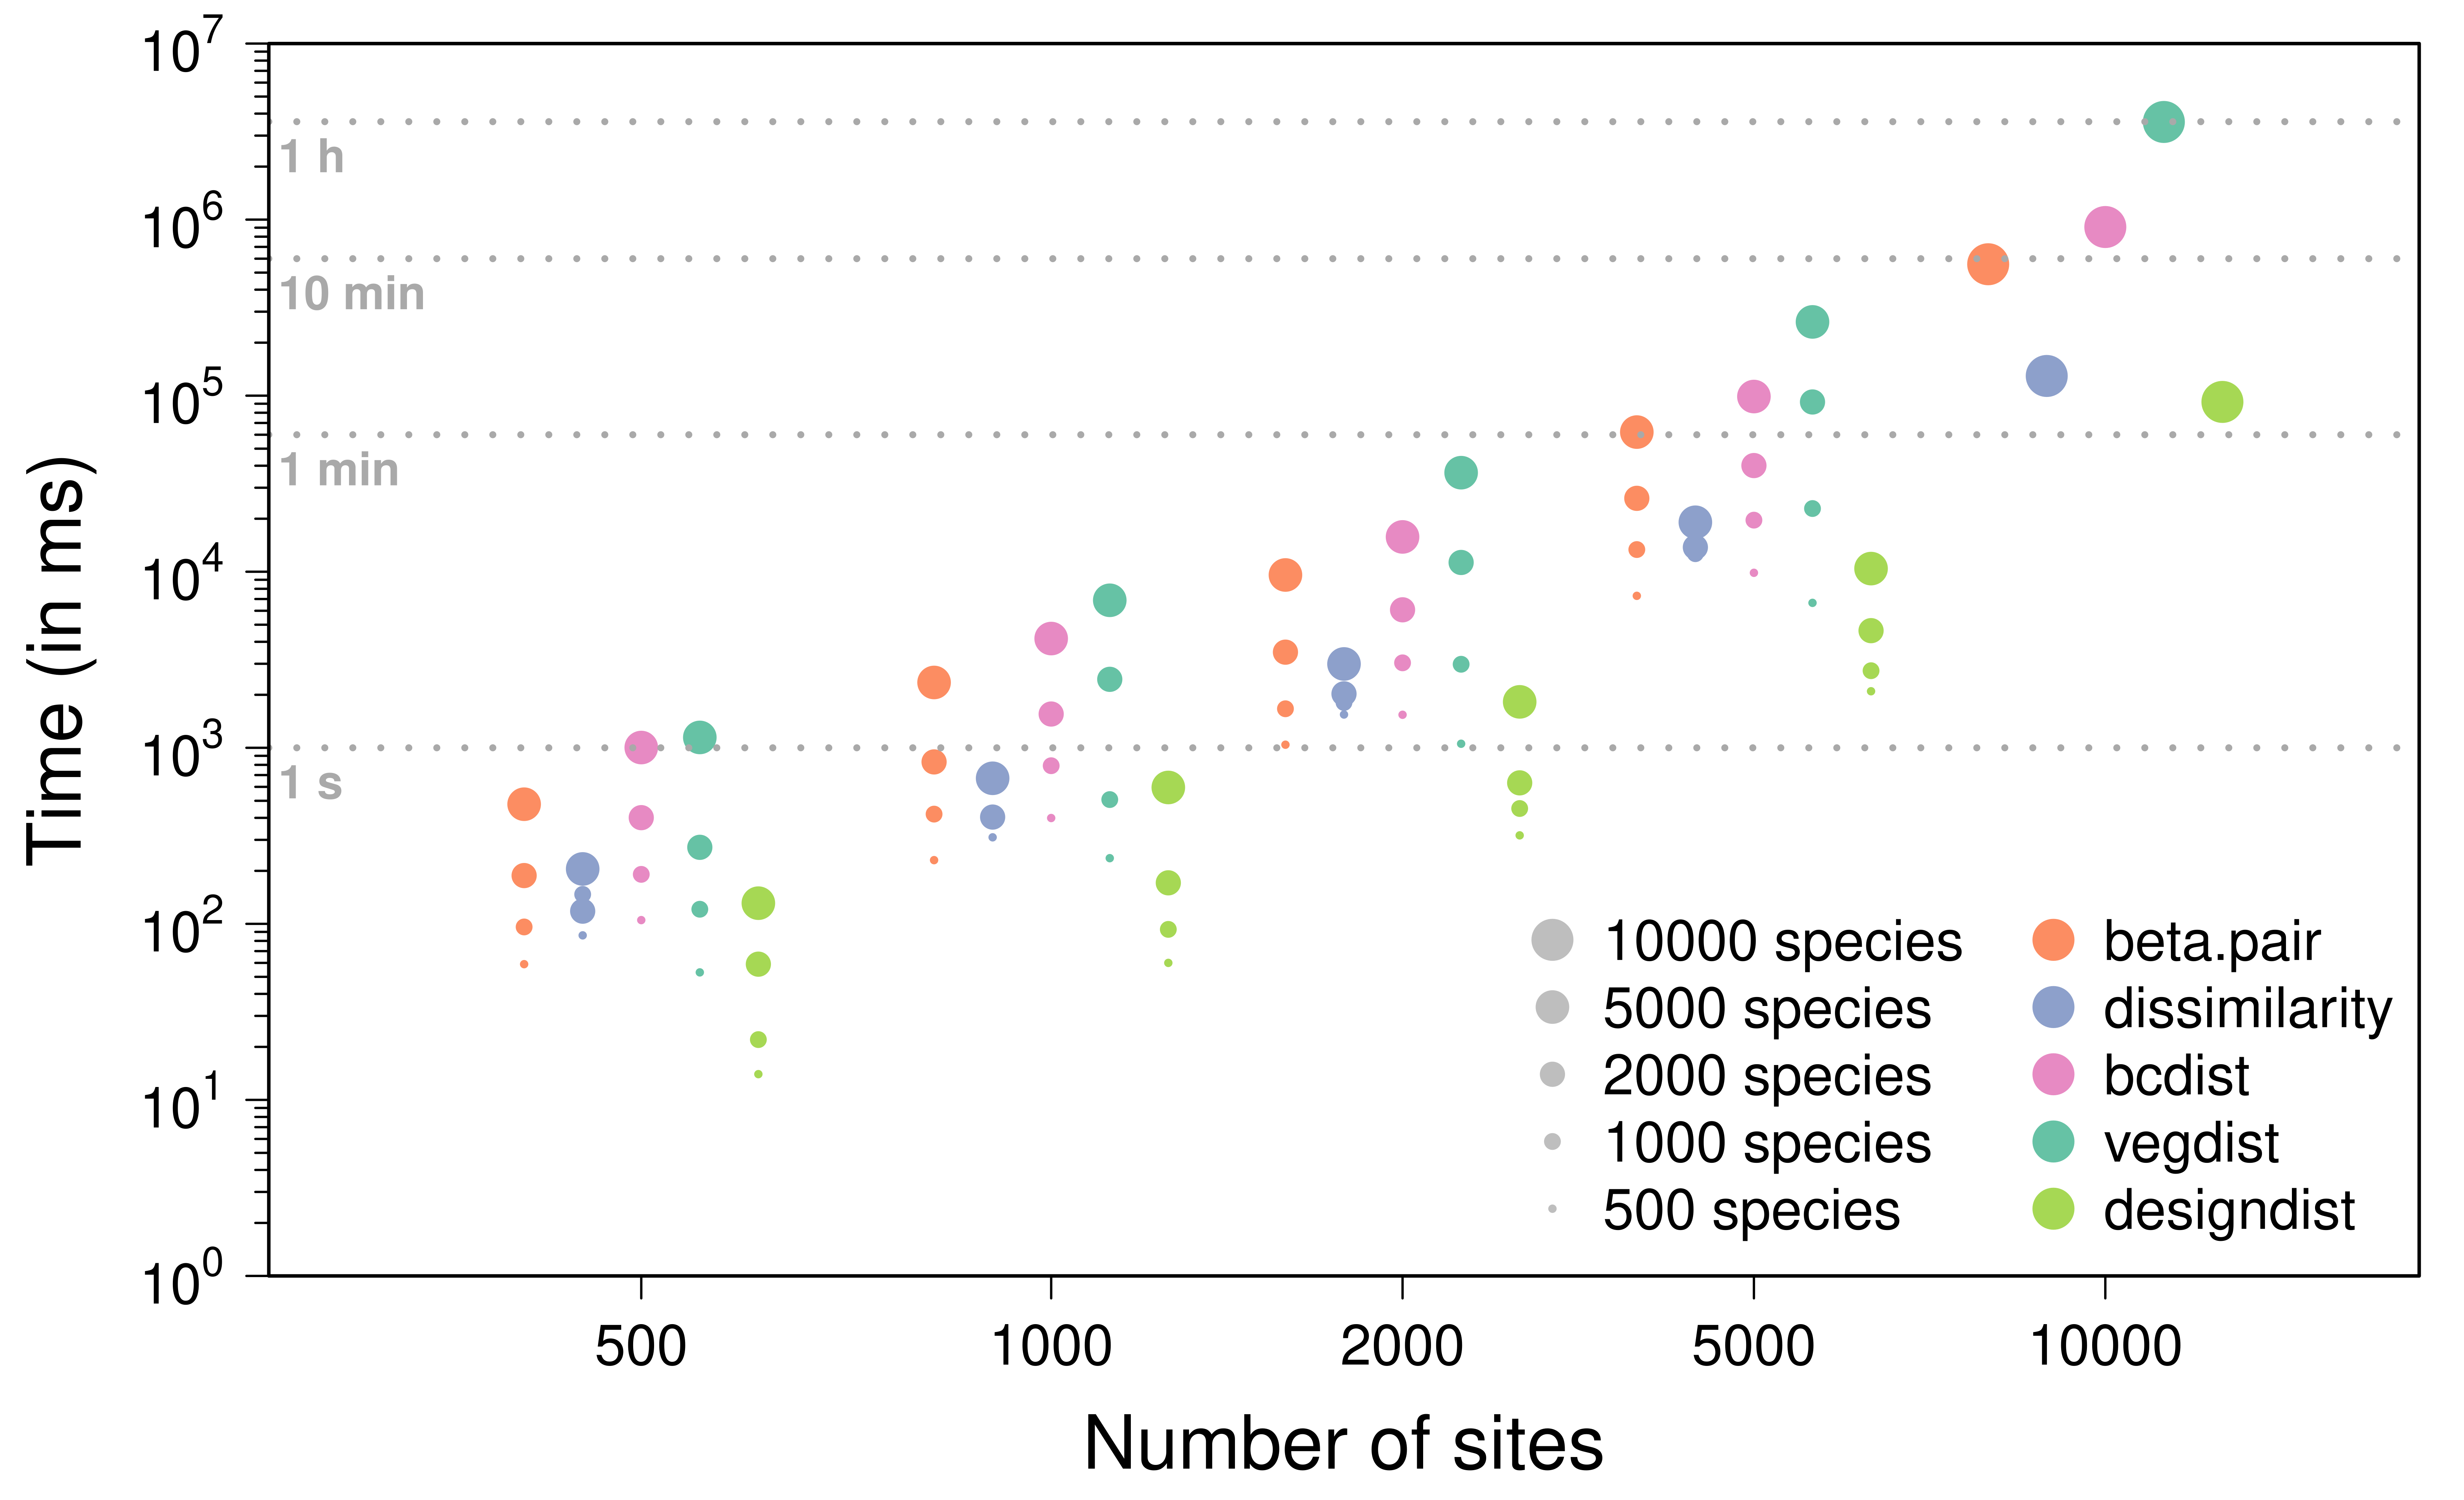
The plot below shows the results obtained for the Jaccard dissimilarity metric based on 16 combinations of numbers of sites and species (chosen among 500, 1000, 2000, and 5000), averaged over three replications. We also include the results from a single simulation with 10,000 sites and species.
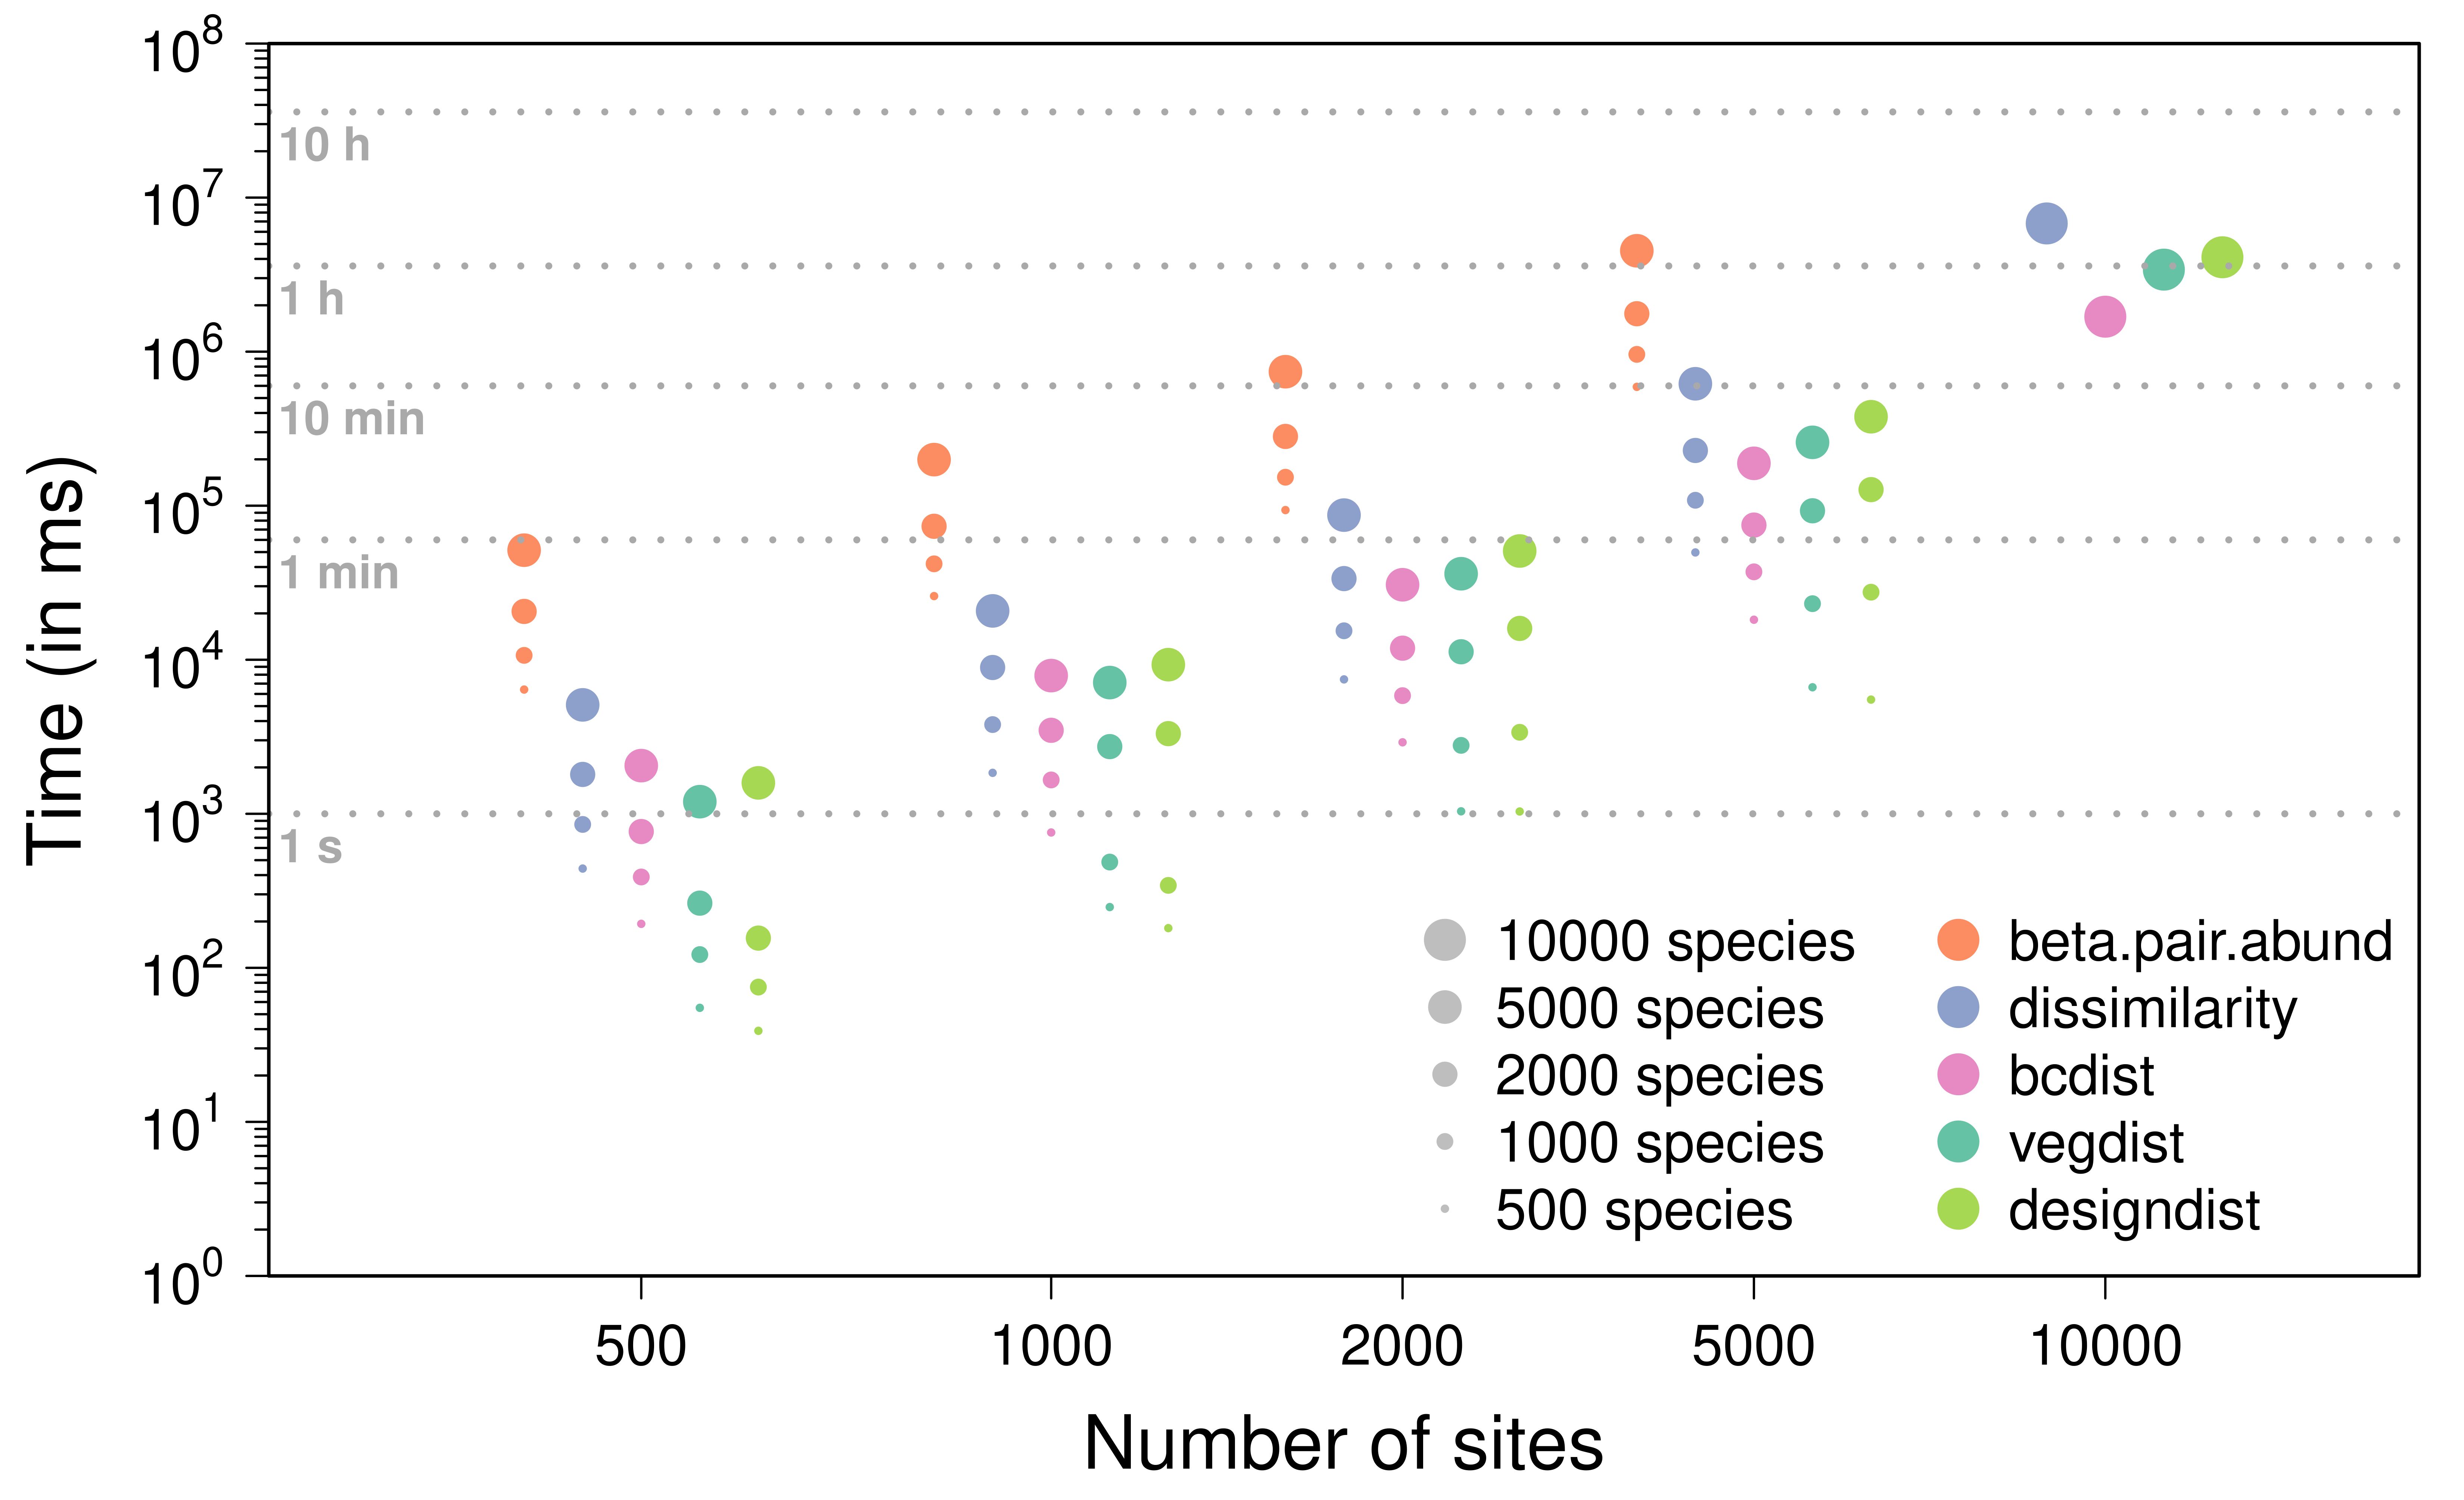
A similar plot showing the results obtained for the Bray-Curtis
dissimilarity metric is available below. In this case, the results based
on a single simulation with 10,000 sites and species exclude
beta.pair.abund because it took too much time to
compute.
5. Importing pairwise (dis)similarity metrics from other packages into bioregion
To enable the conversion of (dis)similarity metrics stored in base R
objects
or outputs from other packages into a bioregion.pairwise
object
compatible with the bioregion package, we developed the as_bioregion_pairwise()
function.
This function can take as input matrix, a
dist object, or a list of these
dissim1 <- dissimilarity(vegemat,
                         metric = "Euclidean")
dissim1[1:10,]
## Data.frame of dissimilarity between sites
## - Total number of sites: 715
## - Total number of species: 3697
## - Number of rows: 255255
## - Number of dissimilarity metrics: 1
##
##
## Site1 Site2 Euclidean
## 2 35 36 3262.6011
## 3 35 37 1378.7897
## 4 35 38 1275.4031
## 5 35 39 485.7993
## 6 35 84 66.2948
## 7 35 85 354.5885
## 8 35 86 2311.7883
## 9 35 87 2039.7632
## 10 35 88 2239.1117
## 11 35 89 226.8237
dissim2 <- as_bioregion_pairwise(dist(vegemat),
                                 metric_name = "Euclidean")
dissim2[1:10,]
## Data.frame of dissimilarity between sites
## - Total number of sites: 715
## - Total number of species: NA
## - Number of rows: 255255
## - Number of dissimilarity metrics: 1
##
##
## Site1 Site2 Euclidean
## 2 35 36 3262.6011
## 3 35 37 1378.7897
## 4 35 38 1275.4031
## 5 35 39 485.7993
## 6 35 84 66.2948
## 7 35 85 354.5885
## 8 35 86 2311.7883
## 9 35 87 2039.7632
## 10 35 88 2239.1117
## 11 35 89 226.8237but also outputs from 10 functions provided by the packages adespatial, betapart, ecodist and vegan described above.
5.1 adespatial::beta.div
dissim1 <- dissimilarity(comat,
                         metric = "Euclidean")
dissim1[1:10,]
## Data.frame of dissimilarity between sites
## - Total number of sites: 100
## - Total number of species: 200
## - Number of rows: 4950
## - Number of dissimilarity metrics: 1
##
##
## Site1 Site2 Euclidean
## 2 s1 s2 5.663259
## 3 s1 s3 6.174723
## 4 s1 s4 6.273630
## 5 s1 s5 6.143276
## 6 s1 s6 5.545510
## 7 s1 s7 6.024138
## 8 s1 s8 6.124431
## 9 s1 s9 5.548479
## 10 s1 s10 6.362439
## 11 s1 s11 6.001393
dissim2 <- as_bioregion_pairwise(beta.div(comat,
                                          method = "euclidean",
                                          save.D = TRUE),
                                 pkg = "adespatial")
dissim2[1:10,]
## Data.frame of dissimilarity between sites
## - Total number of sites: 100
## - Total number of species: NA
## - Number of rows: 4950
## - Number of dissimilarity metrics: 1
##
##
## Site1 Site2 euclidean
## 2 s1 s2 5.663259
## 3 s1 s3 6.174723
## 4 s1 s4 6.273630
## 5 s1 s5 6.143276
## 6 s1 s6 5.545510
## 7 s1 s7 6.024138
## 8 s1 s8 6.124431
## 9 s1 s9 5.548479
## 10 s1 s10 6.362439
## 11 s1 s11 6.0013935.2 adespatial::beta.div.comp
dissim1 <- dissimilarity(comatbin,
                         metric = c("Jaccard","abc"))
dissim1[1:10,]
## Data.frame of dissimilarity between sites
## - Total number of sites: 100
## - Total number of species: 200
## - Number of rows: 4950
## - Number of dissimilarity metrics: 1
##
##
## Site1 Site2 Jaccard a b c
## 2 s1 s2 0.7708333 22 37 37
## 3 s1 s3 0.8666667 14 45 46
## 4 s1 s4 0.8679245 14 45 47
## 5 s1 s5 0.8543689 15 44 44
## 6 s1 s6 0.7843137 22 37 43
## 7 s1 s7 0.8392857 18 41 53
## 8 s1 s8 0.8256881 19 40 50
## 9 s1 s9 0.8105263 18 41 36
## 10 s1 s10 0.8842105 11 48 36
## 11 s1 s11 0.8666667 14 45 46
dissim2 <- as_bioregion_pairwise(beta.div.comp(comatbin,
                                               save.abc = TRUE),
                                 pkg = "adespatial")
dissim2[1:10,]
## Data.frame of dissimilarity between sites
## - Total number of sites: 100
## - Total number of species: NA
## - Number of rows: 4950
## - Number of dissimilarity metrics: 1
##
##
## Site1 Site2 Podani family, Jaccard a b c
## 2 s1 s2 0.7708333 22 37 37
## 3 s1 s3 0.8666667 14 45 46
## 4 s1 s4 0.8679245 14 45 47
## 5 s1 s5 0.8543689 15 44 44
## 6 s1 s6 0.7843137 22 37 43
## 7 s1 s7 0.8392857 18 41 53
## 8 s1 s8 0.8256881 19 40 50
## 9 s1 s9 0.8105263 18 41 36
## 10 s1 s10 0.8842105 11 48 36
## 11 s1 s11 0.8666667 14 45 465.3 betapart::beta.pair
dissim1 <- dissimilarity(comatbin,
                         metric = c("Jaccard","Jaccardturn"))
dissim1[1:10,]
## Data.frame of dissimilarity between sites
## - Total number of sites: 100
## - Total number of species: 200
## - Number of rows: 4950
## - Number of dissimilarity metrics: 2
##
##
## Site1 Site2 Jaccard Jaccardturn
## 2 s1 s2 0.7708333 0.7708333
## 3 s1 s3 0.8666667 0.8653846
## 4 s1 s4 0.8679245 0.8653846
## 5 s1 s5 0.8543689 0.8543689
## 6 s1 s6 0.7843137 0.7708333
## 7 s1 s7 0.8392857 0.8200000
## 8 s1 s8 0.8256881 0.8080808
## 9 s1 s9 0.8105263 0.8000000
## 10 s1 s10 0.8842105 0.8674699
## 11 s1 s11 0.8666667 0.8653846
dissim2 <- as_bioregion_pairwise(beta.pair(comatbin,
                                           index.family = "jaccard"),
                                 pkg = "betapart")
dissim2[1:10,]
## Data.frame of dissimilarity between sites
## - Total number of sites: 100
## - Total number of species: NA
## - Number of rows: 4950
## - Number of dissimilarity metrics: 3
##
##
## Site1 Site2 beta.jtu beta.jne beta.jac
## 2 s1 s2 0.7708333 0.000000000 0.7708333
## 3 s1 s3 0.8653846 0.001282051 0.8666667
## 4 s1 s4 0.8653846 0.002539913 0.8679245
## 5 s1 s5 0.8543689 0.000000000 0.8543689
## 6 s1 s6 0.7708333 0.013480392 0.7843137
## 7 s1 s7 0.8200000 0.019285714 0.8392857
## 8 s1 s8 0.8080808 0.017607265 0.8256881
## 9 s1 s9 0.8000000 0.010526316 0.8105263
## 10 s1 s10 0.8674699 0.016740647 0.8842105
## 11 s1 s11 0.8653846 0.001282051 0.86666675.4 betapart::beta.pair.abund
dissim1 <- dissimilarity(comat,
                         metric = c("Brayturn","Bray"))
dissim1[1:10,]
## Data.frame of dissimilarity between sites
## - Total number of sites: 100
## - Total number of species: 200
## - Number of rows: 4950
## - Number of dissimilarity metrics: 2
##
##
## Site1 Site2 Bray Brayturn
## 1 s1 s2 0.3109486 0.2907499
## 2 s1 s3 0.3551275 0.3484112
## 3 s1 s4 0.3662292 0.3527945
## 4 s1 s5 0.3644193 0.3607606
## 5 s1 s6 0.3053786 0.3002943
## 6 s1 s7 0.3455313 0.3324551
## 7 s1 s8 0.3469113 0.3299002
## 8 s1 s9 0.3184678 0.3143748
## 9 s1 s10 0.4017243 0.3617546
## 10 s1 s11 0.3523224 0.3505070
dissim2 <- as_bioregion_pairwise(beta.pair.abund(comat,
                                                 index.family = "bray"),
                                 pkg = "betapart")
dissim2[1:10,]
## Data.frame of dissimilarity between sites
## - Total number of sites: 100
## - Total number of species: NA
## - Number of rows: 4950
## - Number of dissimilarity metrics: 3
##
##
## Site1 Site2 beta.bray.bal beta.bray.gra beta.bray
## 2 s1 s2 0.2907499 0.020198660 0.3109486
## 3 s1 s3 0.3484112 0.006716346 0.3551275
## 4 s1 s4 0.3527945 0.013434676 0.3662292
## 5 s1 s5 0.3607606 0.003658700 0.3644193
## 6 s1 s6 0.3002943 0.005084275 0.3053786
## 7 s1 s7 0.3324551 0.013076199 0.3455313
## 8 s1 s8 0.3299002 0.017011065 0.3469113
## 9 s1 s9 0.3143748 0.004093053 0.3184678
## 10 s1 s10 0.3617546 0.039969771 0.4017243
## 11 s1 s11 0.3505070 0.001815369 0.35232245.5 betapart::betapart.core
dissim1 <- dissimilarity(comatbin,
                         metric = "abc",
                         formula = c("pmin(b,c)","pmax(b,c)","b+c"))
dissim1[1:10,]
## Data.frame of dissimilarity between sites
## - Total number of sites: 100
## - Total number of species: 200
## - Number of rows: 4950
## - Number of dissimilarity metrics: 3
##
##
## Site1 Site2 a b c pmin(b,c) pmax(b,c) b+c
## 2 s1 s2 22 37 37 37 37 74
## 3 s1 s3 14 45 46 45 46 91
## 4 s1 s4 14 45 47 45 47 92
## 5 s1 s5 15 44 44 44 44 88
## 6 s1 s6 22 37 43 37 43 80
## 7 s1 s7 18 41 53 41 53 94
## 8 s1 s8 19 40 50 40 50 90
## 9 s1 s9 18 41 36 36 41 77
## 10 s1 s10 11 48 36 36 48 84
## 11 s1 s11 14 45 46 45 46 91
dissim2 <- as_bioregion_pairwise(betapart.core(comatbin),
                                 pkg = "betapart")
dissim2[1:10,]
## Data.frame of dissimilarity between sites
## - Total number of sites: 100
## - Total number of species: NA
## - Number of rows: 4950
## - Number of dissimilarity metrics: 3
##
##
## Site1 Site2 a b c min(b,c) max(b,c) sum(b,c)
## 2 s1 s2 22 37 37 37 37 74
## 3 s1 s3 14 45 46 45 46 91
## 4 s1 s4 14 45 47 45 47 92
## 5 s1 s5 15 44 44 44 44 88
## 6 s1 s6 22 37 43 37 43 80
## 7 s1 s7 18 41 53 41 53 94
## 8 s1 s8 19 40 50 40 50 90
## 9 s1 s9 18 41 36 36 41 77
## 10 s1 s10 11 48 36 36 48 84
## 11 s1 s11 14 45 46 45 46 915.6 betapart::betapart.core.abund
dissim1 <- dissimilarity(comat,
                         metric = "ABC",
                         formula = c("pmin(B,C)","pmax(B,C)","B+C"))
dissim1[1:10,]
## Data.frame of dissimilarity between sites
## - Total number of sites: 100
## - Total number of species: 200
## - Number of rows: 4950
## - Number of dissimilarity metrics: 3
##
##
## Site1 Site2 A B C pmin(B,C) pmax(B,C) B+C
## 2 s1 s2 70.62846 28.95342 34.79166 28.95342 34.79166 63.74508
## 3 s1 s3 64.88645 34.69544 36.76973 34.69544 36.76973 71.46517
## 4 s1 s4 64.44994 35.13194 39.35382 35.13194 39.35382 74.48576
## 5 s1 s5 62.93214 36.64975 35.51632 35.51632 36.64975 72.16607
## 6 s1 s6 69.67801 29.90388 31.36165 29.90388 31.36165 61.26553
## 7 s1 s7 66.47538 33.10650 37.08577 33.10650 37.08577 70.19227
## 8 s1 s8 66.72980 32.85209 38.03973 32.85209 38.03973 70.89181
## 9 s1 s9 67.46550 32.11639 30.93447 30.93447 32.11639 63.05086
## 10 s1 s10 56.06630 43.51559 31.77812 31.77812 43.51559 75.29371
## 11 s1 s11 64.31719 35.26470 34.70958 34.70958 35.26470 69.97427
dissim2 <- as_bioregion_pairwise(betapart.core.abund(comat),
                                 pkg = "betapart")
dissim2[1:10,]
## Data.frame of dissimilarity between sites
## - Total number of sites: 100
## - Total number of species: NA
## - Number of rows: 4950
## - Number of dissimilarity metrics: 3
##
##
## Site1 Site2 A min(B,C) max(B,C) sum(B,C)
## 2 s1 s2 70.62846 28.95342 34.79166 63.74508
## 3 s1 s3 64.88645 34.69544 36.76973 71.46517
## 4 s1 s4 64.44994 35.13194 39.35382 74.48576
## 5 s1 s5 62.93214 35.51632 36.64975 72.16607
## 6 s1 s6 69.67801 29.90388 31.36165 61.26553
## 7 s1 s7 66.47538 33.10650 37.08577 70.19227
## 8 s1 s8 66.72980 32.85209 38.03973 70.89181
## 9 s1 s9 67.46550 30.93447 32.11639 63.05086
## 10 s1 s10 56.06630 31.77812 43.51559 75.29371
## 11 s1 s11 64.31719 34.70958 35.26470 69.974275.7 ecodist::distance
dissim1 <- dissimilarity(comatbin,
                         metric = "Jaccard")
dissim1[1:10,]
## Data.frame of dissimilarity between sites
## - Total number of sites: 100
## - Total number of species: 200
## - Number of rows: 4950
## - Number of dissimilarity metrics: 1
##
##
## Site1 Site2 Jaccard
## 2 s1 s2 0.7708333
## 3 s1 s3 0.8666667
## 4 s1 s4 0.8679245
## 5 s1 s5 0.8543689
## 6 s1 s6 0.7843137
## 7 s1 s7 0.8392857
## 8 s1 s8 0.8256881
## 9 s1 s9 0.8105263
## 10 s1 s10 0.8842105
## 11 s1 s11 0.8666667
dissim2 <- as_bioregion_pairwise(distance(comatbin,
                                          method="jaccard"),
                                 pkg = "ecodist")
dissim2[1:10,]
## Data.frame of dissimilarity between sites
## - Total number of sites: 100
## - Total number of species: NA
## - Number of rows: 4950
## - Number of dissimilarity metrics: 1
##
##
## Site1 Site2 jaccard
## 2 s1 s2 0.7708333
## 3 s1 s3 0.8666667
## 4 s1 s4 0.8679245
## 5 s1 s5 0.8543689
## 6 s1 s6 0.7843137
## 7 s1 s7 0.8392857
## 8 s1 s8 0.8256881
## 9 s1 s9 0.8105263
## 10 s1 s10 0.8842105
## 11 s1 s11 0.86666675.8 ecodist::bcdist
dissim1 <- dissimilarity(comat,
                         metric = "Bray")
dissim1[1:10,]
## Data.frame of dissimilarity between sites
## - Total number of sites: 100
## - Total number of species: 200
## - Number of rows: 4950
## - Number of dissimilarity metrics: 1
##
##
## Site1 Site2 Bray
## 1 s1 s2 0.3109486
## 2 s1 s3 0.3551275
## 3 s1 s4 0.3662292
## 4 s1 s5 0.3644193
## 5 s1 s6 0.3053786
## 6 s1 s7 0.3455313
## 7 s1 s8 0.3469113
## 8 s1 s9 0.3184678
## 9 s1 s10 0.4017243
## 10 s1 s11 0.3523224
dissim2 <- as_bioregion_pairwise(bcdist(comat),
                                 pkg = "ecodist")
dissim2[1:10,]
## Data.frame of dissimilarity between sites
## - Total number of sites: 100
## - Total number of species: NA
## - Number of rows: 4950
## - Number of dissimilarity metrics: 1
##
##
## Site1 Site2 bray-curtis
## 2 s1 s2 0.3109486
## 3 s1 s3 0.3551275
## 4 s1 s4 0.3662292
## 5 s1 s5 0.3644193
## 6 s1 s6 0.3053786
## 7 s1 s7 0.3455313
## 8 s1 s8 0.3469113
## 9 s1 s9 0.3184678
## 10 s1 s10 0.4017243
## 11 s1 s11 0.35232245.9 vegan::vegdist
dissim1 <- dissimilarity(comatbin,
                         metric = "Jaccard")
dissim1[1:10,]
## Data.frame of dissimilarity between sites
## - Total number of sites: 100
## - Total number of species: 200
## - Number of rows: 4950
## - Number of dissimilarity metrics: 1
##
##
## Site1 Site2 Jaccard
## 2 s1 s2 0.7708333
## 3 s1 s3 0.8666667
## 4 s1 s4 0.8679245
## 5 s1 s5 0.8543689
## 6 s1 s6 0.7843137
## 7 s1 s7 0.8392857
## 8 s1 s8 0.8256881
## 9 s1 s9 0.8105263
## 10 s1 s10 0.8842105
## 11 s1 s11 0.8666667
dissim2 <- as_bioregion_pairwise(vegdist(comatbin,
                                         method="jaccard"),
                                 pkg = "vegan")
dissim2[1:10,]
## Data.frame of dissimilarity between sites
## - Total number of sites: 100
## - Total number of species: NA
## - Number of rows: 4950
## - Number of dissimilarity metrics: 1
##
##
## Site1 Site2 jaccard
## 2 s1 s2 0.7708333
## 3 s1 s3 0.8666667
## 4 s1 s4 0.8679245
## 5 s1 s5 0.8543689
## 6 s1 s6 0.7843137
## 7 s1 s7 0.8392857
## 8 s1 s8 0.8256881
## 9 s1 s9 0.8105263
## 10 s1 s10 0.8842105
## 11 s1 s11 0.86666675.10 vegan::designdist
dissim1 <- dissimilarity(comat,
                         metric = "Bray",
                         formula = "(B + C) / (2*A + B + C)")
dissim1[1:10,]
## Data.frame of dissimilarity between sites
## - Total number of sites: 100
## - Total number of species: 200
## - Number of rows: 4950
## - Number of dissimilarity metrics: 2
##
##
## Site1 Site2 Bray (B + C) / (2*A + B + C)
## 1 s1 s2 0.3109486 0.3109486
## 2 s1 s3 0.3551275 0.3551275
## 3 s1 s4 0.3662292 0.3662292
## 4 s1 s5 0.3644193 0.3644193
## 5 s1 s6 0.3053786 0.3053786
## 6 s1 s7 0.3455313 0.3455313
## 7 s1 s8 0.3469113 0.3469113
## 8 s1 s9 0.3184678 0.3184678
## 9 s1 s10 0.4017243 0.4017243
## 10 s1 s11 0.3523224 0.3523224
dissim2 <- as_bioregion_pairwise(designdist(comat,
                                            method = "(A+B-2*J)/(A+B)",
                                            terms = "minimum"),
                                 pkg = "vegan")
dissim2[1:10,]
## Data.frame of dissimilarity between sites
## - Total number of sites: 100
## - Total number of species: NA
## - Number of rows: 4950
## - Number of dissimilarity metrics: 1
##
##
## Site1 Site2 minimum (A+B-2*J)/(A+B)
## 2 s1 s2 0.3109486
## 3 s1 s3 0.3551275
## 4 s1 s4 0.3662292
## 5 s1 s5 0.3644193
## 6 s1 s6 0.3053786
## 7 s1 s7 0.3455313
## 8 s1 s8 0.3469113
## 9 s1 s9 0.3184678
## 10 s1 s10 0.4017243
## 11 s1 s11 0.35232246. Combine and enrich (dis)similarity objects
It is also possible to use the function bind_pairwise()
to combine two bioregion.pairwise objects and/or compute
new pairwise metrics based on the columns of the object(s). This
function is particularly useful for deriving new metrics from the
components \(a\), \(b\), and \(c\), and/or \(A\), \(B\), and \(C\), especially when these components
required significant computation time.
dissim1 <- dissimilarity(comat,
                         metric = c("ABC","Bray"),
                         formula = "(B + C) / (2*A + B + C)")

dissim2 <- as_bioregion_pairwise(designdist(comat,
                                            method = "(A+B-2*J)/(A+B)",
                                            terms = "minimum"),
                                 pkg = "vegan")

dissim <- bind_pairwise(primary_metrics = dissim1,
                        secondary_metrics = dissim2,
                        new_metrics = c("(B + C) / (2*A + B + C)", "Bray*Bray"))

dissim[1:10,]
## Data.frame of dissimilarity between sites
## - Total number of sites: 100
## - Total number of species: NA
## - Number of rows: 4950
## - Number of dissimilarity metrics: 5
##
##
## Site1 Site2 Bray A B C (B + C) / (2*A + B + C)
## 1 s1 s2 0.3109486 70.62846 28.95342 34.79166 0.3109486
## 2 s1 s3 0.3551275 64.88645 34.69544 36.76973 0.3551275
## 3 s1 s4 0.3662292 64.44994 35.13194 39.35382 0.3662292
## 4 s1 s5 0.3644193 62.93214 36.64975 35.51632 0.3644193
## 5 s1 s6 0.3053786 69.67801 29.90388 31.36165 0.3053786
## 6 s1 s7 0.3455313 66.47538 33.10650 37.08577 0.3455313
## 7 s1 s8 0.3469113 66.72980 32.85209 38.03973 0.3469113
## 8 s1 s9 0.3184678 67.46550 32.11639 30.93447 0.3184678
## 9 s1 s10 0.4017243 56.06630 43.51559 31.77812 0.4017243
## 10 s1 s11 0.3523224 64.31719 35.26470 34.70958 0.3523224
## minimum (A+B-2*J)/(A+B) (B + C) / (2*A + B + C) Bray*Bray
## 1 0.3109486 0.3109486 0.09668901
## 2 0.3551275 0.3551275 0.12611554
## 3 0.3662292 0.3662292 0.13412382
## 4 0.3644193 0.3644193 0.13280139
## 5 0.3053786 0.3053786 0.09325609
## 6 0.3455313 0.3455313 0.11939186
## 7 0.3469113 0.3469113 0.12034745
## 8 0.3184678 0.3184678 0.10142177
## 9 0.4017243 0.4017243 0.16138245
## 10 0.3523224 0.3523224 0.12413106